I've spent the past two weeks talking about the centralization of power on the Internet. To summarize, core Internet services are overwhelmingly based in the US, to such a degree that the US could block huge swaths of the Internet if it wanted to.
This makes the Internet fragile; it provides a central point of failure. A stable Internet is one whose management is decentralized, one of the Internet Society's critical properties.
How close—or far—are we from that decentralized Internet?

The answer is: far, and getting further.
With my Internet Society collaborators, I’ve been working on a quantitative measure of the Internet’s (de)centralization.
Measuring Internet centralization
In economics, there's a notion of inequality captured by the Gini coefficient. Take income inequality: if everyone in a country has the same income, its Gini coefficient would be 0. If one person gets all the money and no one else gets anything, its Gini coefficient would be 1. The real world is somewhere in between. According to WorldBank, Czechia’s Gini coefficient is .242—relatively equal—and the United States’ is .411—relatively unequal.
Instead of a Gini coefficient of income, I made a Gini coefficient of each country’s marketshare of Internet service providers [1], weighted by that country’s Internet-using population [2]. The measure would be close to zero if every Internet user were proportionally represented by a marketshare in their jurisdiction, and close to one if a jurisdiction representing some minority of people controlled most of the Internet.
What we found
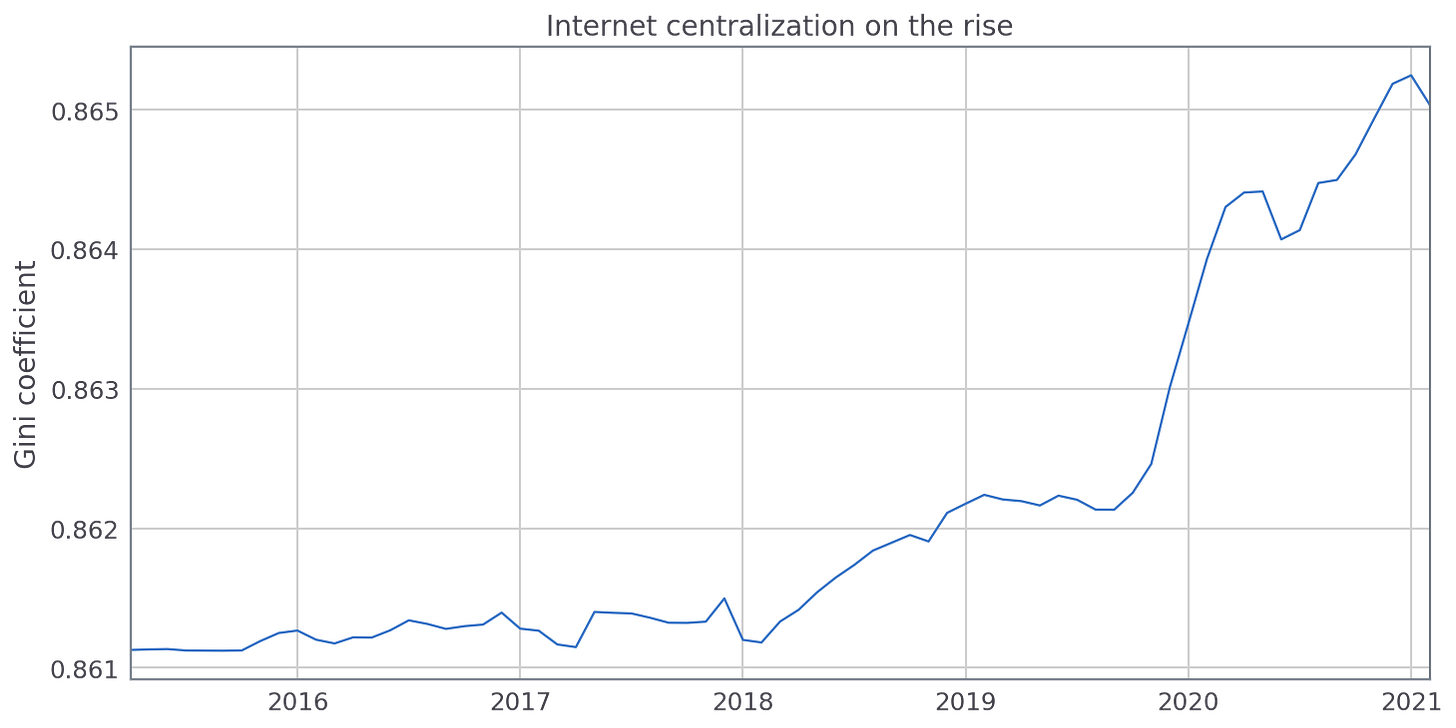
As you can see in the chart above, our measure is close to one—and trending upward. Currently, the Gini coefficient is 0.862. For comparison, the world’s most unequal country, South Africa, has an income inequality Gini coefficient of 0.63.
In other words, a minority of the world’s population controls the vast majority of the Internet’s core services. The inequality is extreme. And it appears to be increasing.
So what?
This measure tells us what we already know: power over the Internet is not distributed fairly, making the Internet fragile. So why does this metric matter?
Well, this metric gives us a tool for understanding whether the situation is getting better or worse. Right now, it’s getting worse. That’s actually something we didn’t have a comprehensive way of knowing before.
But not all is lost here. The goal of this metric is to help us—as a global community—increase the Internet’s resilience. Its job is to act as a guide as we do so.
Imagine you’re a policymaker, say in the European Union. You want to make some policy that will “level the playing field” or help European companies take a more proportional share of the Internet. Will your intervention work?
With some simulation, you—or any watchdog organization—could use this metric to see if your policy would have a positive or negative effect, and how big of one. Then, if the policy is enacted, you—and everyone else—could track this metric over time to see how it coheres to (or diverges from) the value we expected.
I’ve discussed this concept before: it’s an analogy to macroeconomics. Our predictions might be wrong, the policy might misfire, but at least we’d be able to improve our theories on the other side. That’s more than we can say now.
Of course, this is not the perfect metric, or the be-all and end-all metric. It’s not meant to be. Its goal is to get Internet governance folks to debate more the way economists debate: with “macro” data and “macro” theories. Imperfect ones, but improving with experience.
Now what?
An unnamed tipster wrote in about last week’s post. They said that the narrative of US dominance, especially of certificate authorities, has led some countries to take nationalistic steps. For example, the EU tried to force browser vendors (think Google, Mozilla) to auto-accept CAs that the EU deemed trustworthy. Since a malicious CA could issue a valid certificate for any website, it’s a huge risk to the entire Internet for browsers to trust a new one. (The browsers refused).
The tipster’s point here is this: the sorts of arguments I’ve made the past few weeks—about US dominance, about Internet centralization—have been used to justify policies that pose a huge risk to the Internet as a whole.
It’s a good point. Could opportunistic policymakers find a way to optimize our metric of Internet inequality, but harm the Internet in doing so?
I’d be curious to “red-team” these metrics a bit—to see how people might optimize the metrics, but produce worse outcomes for the Internet. Perhaps an experiment of some kind, a simulated policy lab with stakeholders, would help us understand “attacks” on these metrics and how they might be abused or misunderstood. Then we could build new, more comprehensive metrics that combat those attacks.
Do you know of any prior work that’s looked at this kind of reward function hacking with public policy? Get in touch if so.
—
Thanks to the Internet Society for funding this work and to collaborators Konstantinos Komaitis, Carl Gahnberg, Andrei Robachevsky, and Mat Ford. Thanks also to Matthias Gelbmann of W3Techs for providing us with data.
Footnotes
[1] We looked at DNS servers, certificate authorities, reverse proxies, data centers, and web hosts. All marketshare data came from W3Techs. We compiled the data about what jurisdiction providers are domiciled in, which you can find here.
[2] The reason for the weighting: we don’t expect each country to have an equal share of the Internet; we don’t expect Vanuatu can’t have the same marketshare as the US. We expect each country to have a marketshare proportional to their Internet-using population.
Using WorldBank’s data on per-country population and per-country Internet usage, we weighted each country’s marketshare by its proportion of the global population of Internet users at the time the measurement was taken. We then took the Gini coefficient of the weighted values.
More detailed methodology, along with code, coming later—soon. Remember the tagline of this blog: more than half-baked, less than peer-reviewed.


